


10. Markel Corporation: Insurance and Investment Portfolio – Valuation Through Float
Exploration of the idea of valuing Markel insurance and investment segments using the concept of float

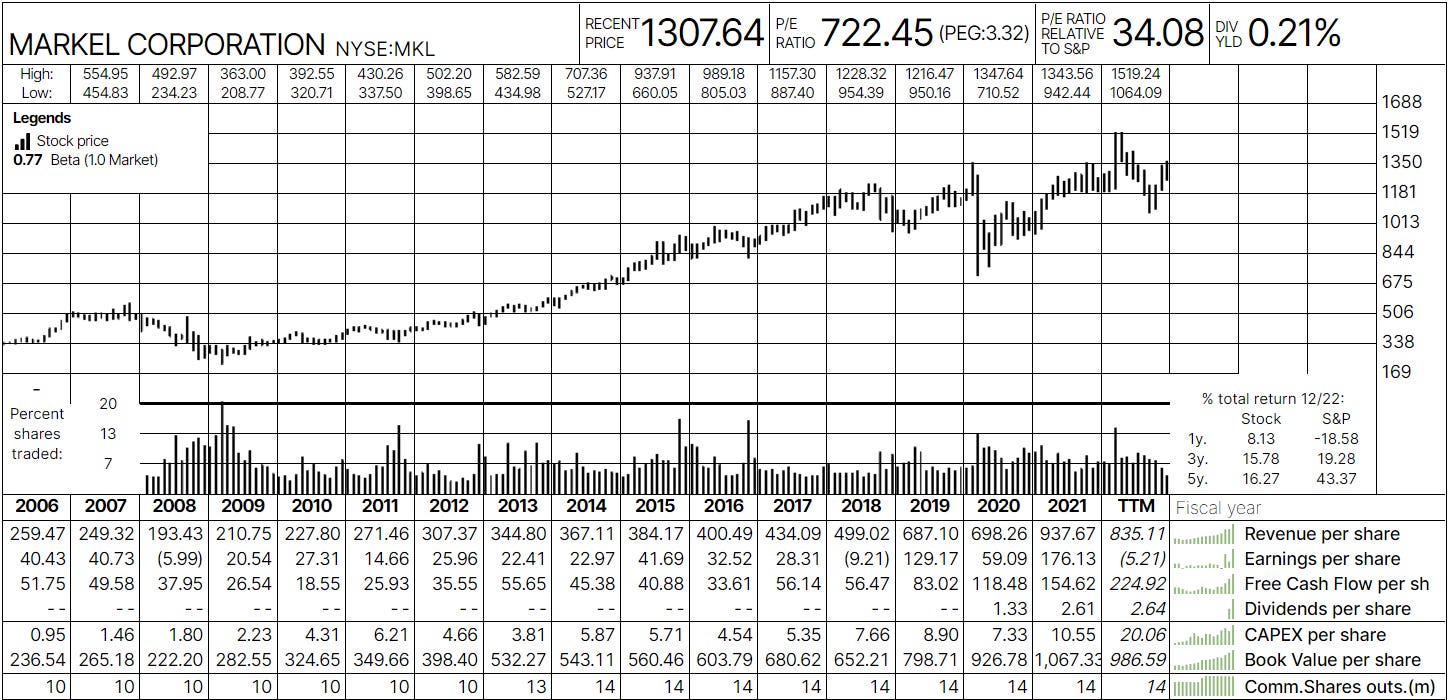
(Source: https://roic.ai/classic/MKL)
For months now, I am obsessed with the idea of finding what would be an acceptable approach in valuing Markel Corporation MKL 0.00%↑ . My general approach in building my position in Markel was as that of my position in Berkshire. When markets collapse, odds are that companies, led by much smarter people than me, would navigate rather better than others through those troubled periods. This is generally an approach most people apply in all of their investments, and more often they fail than succeed. For me, these two cases were rare exceptions. In both cases, there are driven by trust I had in the overall corporate structures of those entities. By this I do not mean their management, but the actual fact that businesses operated under those companies are diversified, mature, profitable for many decades, and operate in slowly changing industries.
However, I like to put numbers on my investments and take solace in them when the world of markets collapses. Therefore, I devised a following approach for calculating, what I believe would be a fair value of Markel as a consolidated entity.
The Approach
I previously wrote about Markel in an article where I replicated Tom Gayners approach to calculating the value of Markel using the “mathematical formula”. I also reflected that the value produced by it is not a value one could expect to see recognized by the market. However, it helped me better understand the engines of value creation in Markel. The approach that I now see fit for calculating it’s the intrinsic value is the following:
Estimate the present value of investment and insurance portfolio together by discounting free cash flow to equity holders
Estimate the present value of Markel Ventures and Nephila ILS separately by discounting the free cash flow to the firm
Calculate the value belonging to the common by reducing the sum of the above by the amount of outstanding debt, preferred claims and non controlling interest.
Add back stable balance of cash and cash equivalents not needed for continuous operations of the Markel,
Assume that all free cash flow to equity is compounded into the future by appropriate internal rate of return produced by any of the three value engines of Markel (this is the most significant value prospect of Markel)
The remainder of this text will focus on point 1.
The Float
To my knowledge, the idea of float and valuing insurance companies through it, gained popularity after the famous Berkshire Hathaway 2009 shareholder letter. Among everything else, following paragraphs gave clue to use and relevance of float:
Insurers receive premiums upfront and pay claims later. In extreme cases, such as those arising from certain workers’ compensation accidents, payments can stretch over decades. This collect-now, pay-later model leaves us holding large sums – money we call “float” – that will eventually go to others. Meanwhile, we get to invest this float for Berkshire’s benefit. Though individual policies and claims come and go, the amount of float we hold remains remarkably stable in relation to premium volume. Consequently, as our business grows, so does our float.
If premiums exceed the total of expenses and eventual losses, we register an underwriting profit that adds to the investment income produced from the float. This combination allows us to enjoy the use of free money – and, better yet, get paid for holding it.
In simplest terms, float of an insurance company is calculated as a difference between premium liabilities (money owed to policyholders at reporting date – cash collected by the company through premiums for future event insurance) and part of premiums yet to be collected from policyholders (cash to be collected in future through contracted premiums), policyholder receivables. In more details, and using Markel balance sheet information, these two elements are defined as sums of:
Policyholder liabilities = Unpaid losses and loss adjustment expenses + Life and annuity benefits + Unearned premiums + Payables to insurance and reinsurance companies
Policyholder receivables = Reinsurance recoverable + Deferred Policy acquisition costs + Prepaid reinsurance premiums
Looking at the latest quarterly financial statements, the following item of the balance sheet are relevant for current float calculation.

(Source: Markel Q3 10-K)
Theory behind the float valuation is that this is a theoretical net amount of capital that an insurance company has at its disposal to manage and invest until those premiums are either earned (insured event did not occur), or result in insurance losses (insured event did occur). If float is stable and/or growing over time together with volume of underwritten premium, the company will also have a stable level of capital to invest in fixed income or equity securities. If it in addition, for underwrites with consistent positive underwriting results, this source of capital is in theory free (although not free from a point of view of opportunity cost), thus providing greater freedom in how the capital could be allocated.
In order to better understand the nature of the float, one needs to look at its evolution over time. Luckily, in case of Markel, elements needed for float calculation can be extracted from online data providers such is TIKR.

As it can be seen, Markel, has managed to grow its float over time. Although, just by looking at the numbers one can say that spectacular growth has been achieved, this growth was also funded with acquisitions, like with State National in November 2017 for USD 918.8 million. But setting aside the driver of growth, for now let focus on the level of float, its cost and what it does.
Cost of float
As for the cost of float, float is free if it’s not causing underwriting losses. Put in other words, if an insurance company can underwrite additional policies without taking miscalculated risks (earned premiums consistently over losses) each period at the time, it is in effect left to manage the float at hand to the best of its abilities (while bounded by the regulation).
To determine the true cost of float, one would need to go back to each vintage and then track the underwriting results until all the premiums from that particular vintage are either earned, ceded or result in losses. This is impossible to do without inside information. However, we can approximate the average cost of float using available disclosed information, and looking at the long term performance.

In case of Markel, underwriting results in past 15 years were the following:

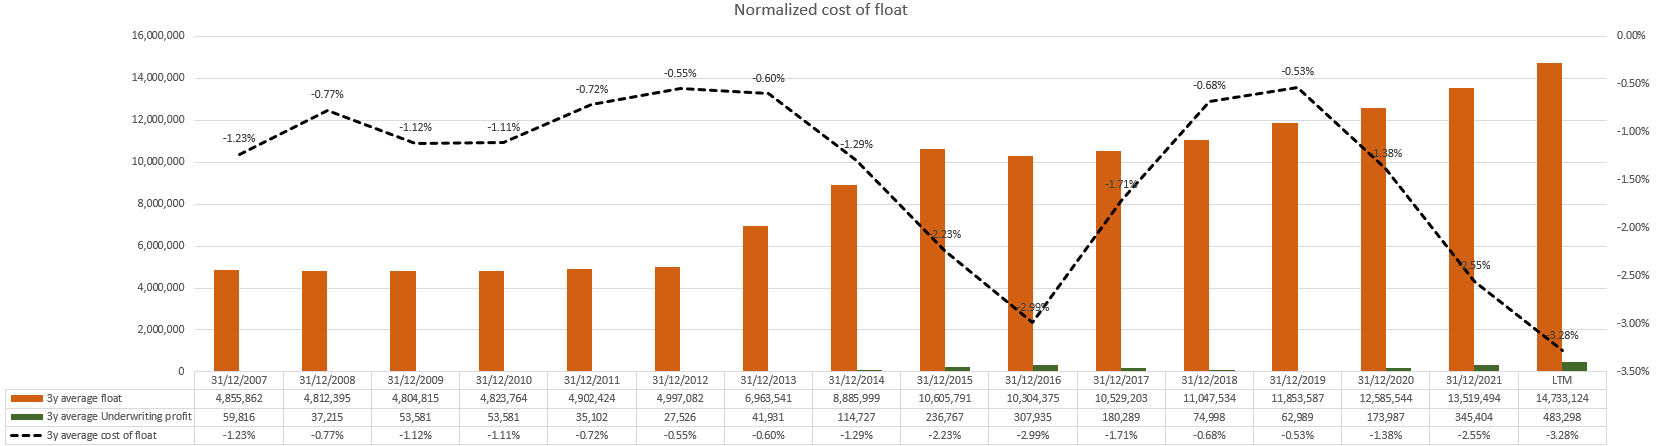
Cost of float would be nothing but the underwriting profit divided by float, and as seen above, 2011 and 2017 would result in positive cost of float (underwriting loss). In order to account for previously mentioned vintage dependencies, and approximate them somehow, it is a prudent approach to smooth out underwriting results over some arbitrary period of time. My best estimate is that this period should be extended over the period in which existing float is earned out. Or in other words, period of time in which earned premium cover the existing float. In the case of Markel, this ratio oscillates between 2 and 3 years, indicating that it take to average this many years for previously written unrealized risks, to equal the amount of existing float. Note that I cannot estimate the amount of previously collected premiums that result in claims and get a more accurate measure of float replacement. However, this approximation would suffice, and for the rest of the analysis I would consider that float is replaced on average in 3 years of underwriting.

Averaging underwriting profits and recorded float over the period of 3 years, we can now calculate normalized cost of float by dividing the two amounts. Figure below shows that Markel has operated with consistent negative cost of float. In other words, it would have profited from holding policyholders’ money, even if it achived zero income on its investments. Preferable outcome for any insurance company.
For later analysis, it is also useful to understand the relation between the combined ratio and underwriting result (cost of float). As seen, maintaining a cost of float at 1.5-2% and combined ratio close to 95% is a sustainable state. In midterm, Markel has goals of reducing their combined ratio close to 90%, implying cost of float of 3.5-4%. This may not sound as a big difference, but it is. As with all leveraged business (banks in a similar way), this small variation have great impacts on overall earnings.

Float utilisation
After we have determined that there is no cost of float, we should see how it is utilized. Markel holds a diversified portfolio of fixed income securities and equities, which has grown over time. As I mentioned in my previous article, all three engines of value are interlinked. Let’s assume, that investment portfolio is used only as a part of the insurance business and that is there to service its requirements.

One can simply calculate the values of the float, compare them with the amount of the total investment portfolio and determine the excess investment over float. In the theory, free float belongs to policyholders, thus they also get a prior claim on the investment portfolio. The excess of invested assets over the float would belong to the common stockholders. But Markel is not a usual insurance companies. Over time, over USD 3 billion were invested into building an equity portfolio that is as of 8th December 2022 worth some USD 6.8 billion. Furthermore, market value of equity portfolio, is quite close to the amount of total investments net of float. At the same time, cost value of equity portfolio almost two times less, indicating that there is no risk of rushed equity portfolio liquidation to meet the policy claims.

The following should be empathized, as these are two of the few hidden strengths of Markel. It does not have to liquidate its equity holdings to meet insurance claims. Furthermore, mark to market value of its fixed income investments alone is enough to cover the float, if liquidation before maturity is needed, in case of underwriting losses throughout good and bad market times. This rarely happens as fixed income portfolio is also held until maturity in overwhelming majority of cases. What is also interesting from the above figure, it appears that bond investments of Markel cover not only present date float, but float size we could expect in next 2 to 3 years. As a result, Markel does not have to liquidate its fixed income holdings before their maturity to meet insurance claims. In both cases, real income in form of coupons and dividends is generated and added to the underwriting profits to result in the free cash flow to the firm (FCFF) and left available for further investments.
In a hypothetical scenario, Markel could liquidate its fixed asset portfolio, reimburse its policyholders, and it will be left with its equity portfolio intact. But it does not have to. Instead, its insurance operations collect the income from its underwriting, it collects the income from its fixed income portfolio, and it collects the income in the form of dividends and realized market gains from its equity portfolio (it also pays taxes on this income – roughly 21%). Since cost of the float is effectively negative, FCFF is effectively belonging to equity holders, i.e. it is a free cash flow to equity (FCFE). Policyholders are entitled to their insurance coverage, for which they ultimately only pay (cost of float is positive for Markel). While the value, the book value, belonging to the common, is equal to total investments net of float.
How do these after tax cash flows behave and compare over time with a broad market index. Well, data shows the following:

Comparing the Markel's FCFE yield against the S&P 500 equivalent (choosing either earnings yield, or buyback and dividend yield), shows clear indication that holding an equity stake in Markel insurance is more valuable prospect than the broad market index, judged by realized cash flow alone. This is not suprising, as everything above showed that the float acts as a free and stable source of leverage to increase Markel's yields. Coincidently, leverage inherently applied to Markel's portfolio (close to between 60% and 70%), is much higher than historical debt to capital of the S&P 500 constituents (close to 30%), albeit at drastically lower costs of leverage (float) in the case of Markel.
Even compared through implied yield on S&P 500 (function of current index value, expected earnings and risk-free rate), common equity, as defined above, yields more.
Markel also provides us with after tax portfolio measurements on different time horizons, their annual statement. Looking at a 10-year period, Markel equity portfolio has clearly outperformed the market index equivalent on after tax basis (17.3% vs 13.34%, or close to 1.3 times more, after tax).

(Source: 2021 Markel annual report)

(Source: https://www.ssga.com/us/en/institutional/etfs/funds/spdr-sp-500-etf-trust-spy)
How much is it worth then?
First, let’s repeat the simplifications of reality we are making:
Markel underwrites risks with consistent through the cycle profits.
Its underwriting profits are enough to finance its float even in the worst years, without forced liquidations of the investment portfolio.
Float is covered with fixed income securities generating interest income, which is excess cash flow to common equity.
Fixed income securities are held to maturity, thus making them effectifly insensitive to market price movements (although the income statement shows the impact).
Excess of investment portfolio over float is invested in growing equity portfolio, which produces dividend and realized capital gains income cash flows to common equity.
Valuation
Previous leads to quite simple approach to valuing Markel Insurance business belonging to the common. We will use the standard discounted cash flow model, where we will be discounting the free cash flow to the equity (FCFE). I will use cost of its equity as a discount rate, derived from current market implied equity risk premium, risk-free rate and Markel's exposure to systematic risks. This would be our measure of opportunity cost, or cost of replicating the financial structure of Markel Insurance. Discounted cash flow value would then be increased by the amount of hypothetical realized capital gains under the assumption that investment part of Markel continues to outperform the market for the next 10 years.
Following assumptions are used:
Markel will continue to operate with underwriting profits close to its past five years of operation in mid term, keeping its combined ratio at 90%-92% range. Measured through return on float before tax, this level of combined ratio alone translates to 4% to 3.5% (each percentage point in combined ratio translates to 0.4% return on float before tax). I also expect that the cash return on float will increase in immediate future as fixed income portfolio is being reinvested at more favorable yields compared to past few years, being close to 3.0%-3.5% on pre-tax basis (levels between 2015 and 2018). Taking the lower estimates and applying some additional buffer, imply return on float of 6% as of next year.
Markel has a 10-5-1 plan, by which it should reach 10 billion in earned premiums with underwriting profit of 1 billion (combined ratio of 90%) by 2026 (five years from end of 2020). This implies float of close to USD 22 billion by then.
Markel will maintain its credit rating and capitalization rate. With this, I assume that the risk being underwritten will not increase and that a similar capitalization rate of 20-23% will be kept. I use this as a proxy of regulatory capital requirements, and as such, I would expect that between 20%-23% of the future growth in float will have to be retained and invested in less attractive alternatives (short term cash or other low risk and low yielding cash alternatives).
Markel will grow its premium volume, and consequently float and investments in equity portfolio with accelerated pace in next midterm period, same as the rest of the insurance industry. Note that Markel has more ambitious goal of growing underwriting profits to 1 billion with combined ratio close to 90% in five-year period, implying 10 billion of earned premiums and float of 22 billion according to what was discussed previously. I would use this and expectations on general premium growth in midterm to model in slightly more than 6% of growth in float until 2027.
Combined ratio will remain in the range of 90% - 93% in midterm, however I will assume that it will be deteriorating slightly into the future (this will affect the underwriting profit to float relative amount, however, equity portfolio yield will not be affected). I would assume that return on float before tax will converge towards 5.5% in 10 years from now. In reality, this is just a wild guess, and will be subject to simulations.
Equity portfolio will continue to outperform S&P 500 by the same margin of 3% Implying a present value of investment operations of USD 9.1 billion (investment growth of 11% on Markel portfolio vs 8% on S&P500), which would translate to potential 6.1 billion of unrealized gains or 4.8 billion after tax. Since my return on float measure uses income from dividends, I will add this expected realized capital gains above currently invested carrying amount of USD 3 billion to the overall sum of the fair value of equity. This is another strong assumption.
Cost of equity was estimated based on risk-free rate of 3.5%, risk premium of 5.5% and beta of 0.61. Regarding the beta itself, I used my own proprietary approach of multiple simulations of Markel's stock price and S&P 500, and estimated betas for 10,000 simulated paths. Bigest driver of cost of equity estimate is terminal risk free rate, and this will be subject to simulations.
This estimate is in line with historical beta for Markel. But more importantly, cost of equity of 6.5% I obtain like this, is in line with historical cost of equity values for different insurance industry segments.

(Source: https://pages.stern.nyu.edu/~adamodar/New_Home_Page/dataarchived.html)
For final terminal value, I would assume that the float will grow with inflation of 2%, producing a return on float before tax of 5.5% while discounted using cost of equity of 6.8%.
All this results in two estimates of insurance and investment parts of Markel. One based on current values, and one based on 3-year average values.
Valuation based on current values as starting point:

Valuation based on average values as starting point:

One could argue against definition of cost of equity, however, assuming that industry average is applicable value for terminal value estimate, internal rate of return on insurance and investment segments, but with using the price of Markel as a whole, suggested in both cases above or equal to what would be the reasonable expectation from abroad market index (8.91% in case of current values and 7.94% in case of averages). However, this is only one part of the sum of Markel. Also, using DCF and FCFE approach assumes that cash availabile to equity holders is highes potential amount of shareholder distribution. In case of Markel we know that the only distribution to shareholders comes in a form of share buyback (ranging from 50 to 200 million per year depending on share price). Rest of the money is reinvested in whatever is safest and highest yielding part of Markel. This is its fundamental strenght that is not widely understood. Almost no dollar earned by Markel is worth less than one dollar. It will compaund.
Other parts of the sum
Regarding the valuation of other parts of the Markel. These will follow up in my next post. However, as a quick solution, we can relate to the values estimated in the analysis of the Markel mathematical value. Maybe note that Markel Ventures will most likely produce something close to USD 500 million EBITDA by year-end once Metromont results are fully included. Finally, we should subtract the outstanding debt, preferred shares exposure, non-controlling interest and lastly add the average outstanding cash and cash equivalents over our relevant period of analysis. This is to follow. Until then subscribe.
Disclaimer and kind request
Before you take any actions based on this article, remember, you are trusting an experimental analysis of an anonymous person. However, if you like it, and you think it makes sense, feel free to suport my writing which I do in my spare time, while working a full time job.
In any case, it does not hurt to subscribe, share this article or comment. It hurts me if you don’t 😇
Best of luck to all of us! 🍀
Thank you for the good analysis (I have a position in $MKL) but I would really like to see some more conservatism in the assumptions. Your current assumptions seem more on the optimistic side of things. Take care and best of luck!
A fantastic read - love your articles