7. Markel Corporation: Drivers of value
My reflections on the mathematical value concept by Tom Gayner
During the last shareholders meeting of Markel Corporation, Thomas Gayner, Markel’s co-CEO, made some comments on how he would calculate what he calls Markel’s “value using the mathematical formula”. It is a simplified view on estimating the true intrinsic value of one business, but one that triggered my interest, since I am still in search for the approach that would help me value companies structured like Markel.
Valuation approach
In 2022 annual shareholders meeting, Tom Gayner, devoted a significant part of the meeting in explaining how he looks at the value Creaton process in Markel and financial outcomes of that process.
Starting from minute 50:00, Tom goes on explaining how he would value Markel if put into analyst shoes. However, later on, he would make a disclaimer that this value does not have to necessarily be reflected in the actual share price of Markel. But, it can serve as a direction indicator of where the value of the Markel as a business is going, and where price might follow. One additional disclaimer he makes is the following:
What any single calculation can never capture though is the intangible value of how each part of Markel is better off because it is part of all of Markel. as my favorite coach John Wooden used to say the main ingredient of stardom is the rest of the team.
In his closing remarks, he also mentions that he is looking forward to continuing this analysis in 12 years from now, if he is not fired in the meantime.
To the best of my understanding, the approach he suggests makes the following assumptions:
Insurance and reinsurance businesses that operate with continuous underwriting profit are left to invest collected premiums at the best of their abilities and regulatory constraints.
Investments in fixed income securities that are usually held to deadlines that meet insurance liabilities are thus funded with minimum cost, and their value is what we currently see on books.
Investments in equities are viewed in the similar way. Markel has historically sold its investments with a profit, thus the value of its equity portfolio is at minimum its current price.
Cash and cash equivalents are simply added to overall mathematical value.
Debt is a negative element. Although used to generate income, this is a share of business owned by other stakeholders, and thus subtracted from the aggregate mathematical value.
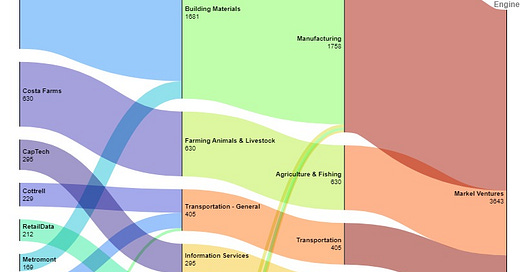
Markel Ventures, a collection of 19 fully owned, mature and profitable independently operated companies, is valued by applying a through the cycle EV to EBITDA ratio. The underlying assumption is that as these are mature business (average founding date Markel Venture companies is 1970), industry averages would apply to them. Furthermore, their results under Markel are obscured by the goodwill amortization. Remember, acquiring old industrial companies usually means that a large part of gross carrying value of their assets was depreciated, even if those assets are operational.
ILS and other businesses are valued using the same principle as for Markel Ventures, by applying an appropriate EV to EBITDA ratio.
Drivers of value
The strong assumption in this approach is that Markel’s float is free of charge, and it will grow or remain stable in the future.
Going through the financial statements until 2007 I collected the following numbers for insurance and reinsurance business:
A quick look at the results would result in an immediate conclusion that Markel does pay a price for its float, however given that it is predominantly speciality insurer, some volatility in underwriting profits is to be expected. Another way to look at these results is in cumulative amounts. In past 14.5 years, close to USD 2.5 billion were cumulated in underwriting profits. This is to be viewed from a starting value of USD 7.3 billion in investments, 0.5 billion in cash and 0.7 billion in debt (invested assets of USD 7.1 billion). Looking through the cycle, they are able to diversify the risks they underwrite, even if such risks sometimes included events like cancellation of 2020 Olympics.
Another element in the calculation of the mathematical value is the development of the investment portfolio. In case of Markel, this portfolio is roughly spilt 60:40 between fixed income securities and equity investments. But because the need to forcefully sell any of their holdings is limited to rare occasions (remember constant underwriting profits), Markel has the privilege of holding its fixed income securities to their maturity, and adjusting their equity portfolio based on their preferences. In their history, their securities’ portfolio did not show negative realized investment results apart in 2008, when net of interest and dividend income, USD 125 million was recognized as a loss. Figure below shows the stream of interest and dividends Markel collected in the period. In cumulative value, this is close to USD 5.3 billion in 14.5 years. This amount can also be compared to the same 2007 invested assets value of USD 7.1 billion mentioned earlier. One should note, that since then and now, some USD 637 million were collected through ordinary and preferred share issuance (albeit more than a USD 1.1 billion was repurchased)
Excess flow of capital was partially used to acquire business that shape what is today Markel Ventures, one of three main value creation engines in Markel.
Ventures is a collection of 19 mature companies spread across multiple industries in sector, but most importantly these are robust businesses in generally stable and unpopular industries (with exception to RetailData working on AI applications and Rosemont Investment Group – small equity management company). Measured through asset size and revenue, Venture’s business doubles every 2 to 3 years through small organic growth and acquisitions of additional businesses.
During the process of its growth and development, Ventures became a significant contributor to the overall cash flow generation of Markel.
Measured among the three, (investment portfolio dividends and interest, underwriting profits and Ventures), Ventures will surrally become the biggest generator of cash before interest, capital expenditure and taxes within Markel. One might say, that Markel is becoming a business operation with some insurance and investments on the side.
However, back to the topic of mathematical value. According to Tom’s approach, the value of the Ventures business should be assessed by applying a reasonable market EV/EBITDA multiple throughout the time. My interpretation of this is that the same value of the multiple should be used in different years, as the goal here is to use a through the cycle measure and avoid periods of optimism and pessimism in the market to drive one’s view on the value.
On a personal note, I do not feel comfortable with pricing, and I will provide a discounted cash flow estimate of Ventures value within the next week or so. Staying true to the method at hand, I have no options but to price it. As I reference, I collected the data on EV to EBITDA multiples from the webpage of Prof. Damodaran and I selected those I found representative of the Markel Ventures current structure (note that Damodaran’s data is based on old Value Line industry segmentation while the one I showed in a graph above follow MSCI GICS definitions).
This data is far from complete, however, my reasonable estimate for EV to EBITDA ratio for Markel Ventures would be 10.
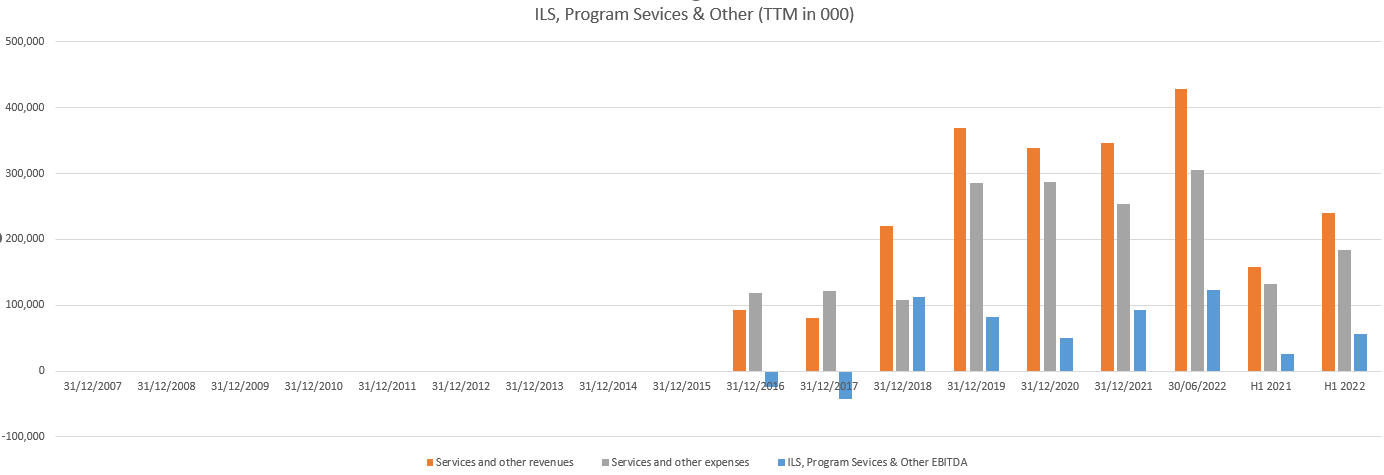
The last part of the Markel, includes what is reported as Nephila ILS (insurance linked securities – instruments similar to CDOs) operations, Program services and other fronting (underwriting on behalf of other insurers) and other (including CATCo runoff). These are not standard insurance business and are viewed by Markel as fee income generating operations. As such, they also are not valued by their net investment value, but rather on the EV to EBITDA multiple pricing approach. Similar, as in the case of Ventures, historical data can give some guidance on a reasonable multiple:
In lack of better evidence, multiple of 10 EV/EBITDA seems to be a reasonable estimate.
As for the performance, other segment of Markel has performed in the following manner during past 14.5 years:
In cumulative, this segment has earned just shy of USD 0.5 billion since its inception.
Now it’s time to bring all these elements together.
Mathematical value
Using the steps I described above, we get the following:
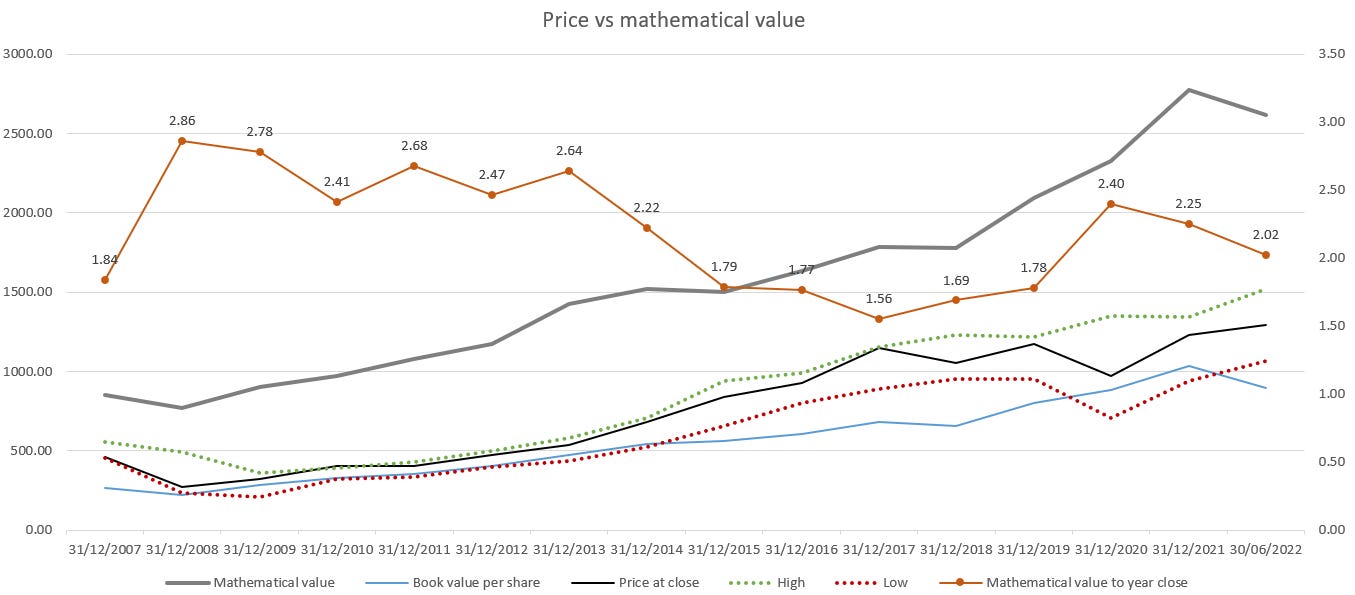
As visible from above, mathematical value per chare is significantly higher than current share price. In fact, in history shown here, it was never reached by price in the preceding year. Relationship, between the price, book value, mathematical value can be more easily be seen here:
Depending on your biases and expectations, these results can be disappointing or promising. Reality is, mathematical value as defined by Tom is not a valuation logic recognised by the market at any given point. If anything, data above tells us that we will have to wait on average 10 years before it’s realized. But, as Tom mentioned, correlation with the price and book value is visible, and the direction is clear. Up and to the right!
Next steps
This exercise did not change my view on Markel, but it did force me to go through multiple years of its financial statements in far more details than before. As a next step I will value Ventures and Other segment seperatelly thorugh DCF analysis, and at least have some parts of the sum actually valued and not priced. Stay tuned.
Fun trivia
Berkshire is the largest single holding in Markel equity portfolio. Through your indirect Berkshire shares, you also own Markel (purchased by Berkshire this year), which builds up your Markel holding a bit more. But with that also your Berkshire holding from your indirect Markel shares increases. If you are confused, then you might be interested in Greek philosopher Zeno and Dichotomy paradox.
Final remark
My substack articles are free to read. I spent considerable amount of time every week researching the companies, and I do it for my benefit. Writing is something I do to interact with you and maybe provide an alternative insight in the companies you already know. If you see the value in my articles, and have cash invested with a promise of a lower value return, fell free to support my writing by clicking below:
Don’t forget to subscribe and follow me on Twitter for my latest updates.
Best of luck to all of us! 🍀


Thanks for the article! When you write "A quick look at the results would result in an immediate conclusion that Markel does pay a price for its float" did you mean "doesn't"? Or am I misinterpreting something?
In your analysis you leave out “Unpaid losses and loss adjustment expenses” from the liabilities side of your calculation, among some other important balance sheet accounts. Is there a reason? My version of MKL valuation is very similar except my net short investments is about $9.4B