


2. Philips: Quantitative Valuation

Summary
Apart from intrinsic valuation, there are other tools I use to evaluate the stock.
I base my investment decisions on a premise that market is efficient, hence modelling the stock.
Based on the results, Philips still looks undervalued.
Analysis
Apart from the intrinsic valuation, prior to making any investment choice, I try to estimate future prices based on historical price movements. Philips (NYSE:PHG), about which I wrote about recently, is no different. This I do only in the case if the narrative I am using for the company future cashflows is similar to past few years of its development (minimum of two is required). This way, I can be at least somewhat sure that historical data is representative enough. In the case of Philips, although its business model is much different now than it was 10 years ago, I still consider it to follow the path it set upon itself even then.
The Approach I use is simple if you have a basic understanding of econometrics. Steps are the following:
1. I collect historical adjusted price time series data. In case of Philips, data as of January 2012 was used.

(Source: Author's Calculations)
2. Based on this data I estimate GARCH (1,1) model.

(Source: Author's Calculations)
3. Using this model and implied volatilities derived from it, I collect standardized residuals for each date in my time series. Think of this as the set of measured, unexplained volatility. I will use this later to add random shocks to forecasted price. Or in other words, I will create a population from which I will randomly draw historical shocks, and use them to perform Monte Carlo simulations.
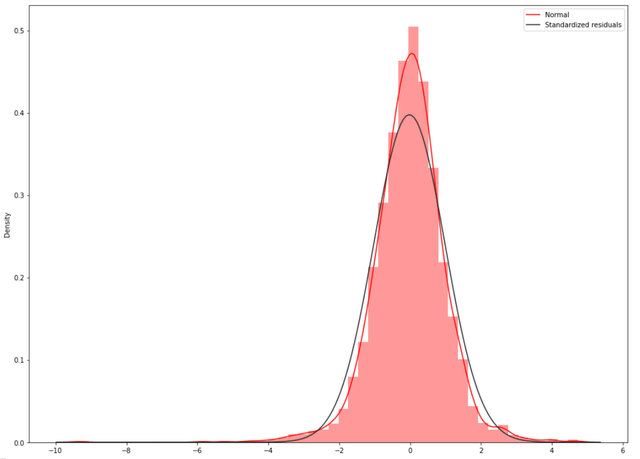
(Source: Author's Calculations)
4. I then define the forecasting horizon and number of simulations I will run as a part of my Monte Carlo simulations. In case of Philips, I was running 10.000 simulations for 252 days in future (one year). Simulations would produce expected stock prices based starting from current market price, and for each day change the prior price for the conditional variance from the model and random shock drawn from the distribution of the standardized residuals I previously obtained.

(Source: Author's Calculations)
5. Finally, I would just plot the end of the forecasting period prices and observe the percentiles of the distribution.

(Source: Author's Calculations)
Although I don't consider this to be a substitute for intrinsic valuation, I find it useful in preparing me for the volatility up ahead. I use this as a tool to try to observe the volatility, and not only depend on its point-in-time measured value. With this, in case of Philips, I would not expect the price to drop to more than EUR 22. With my much higher potential upside calculated based on my intrinsic valuation, I will take the current situation as a temporary one, and I will tolerate price movements between EUR 28 and EUR 39 as normal expected high volatility as long as no new information is there to reduce the uncertainties surrounding Philips.
Hope you enjoyed this. If you have any comments, or you would like to see this analysis for one of your stocks, please leave a comment below.